Portal Guide - PBX Statistics
The PBX Statistics section provides information on calls received on your Hosted PBX system, enabling at-a-glance review of your caller and agent activity.
Search Options
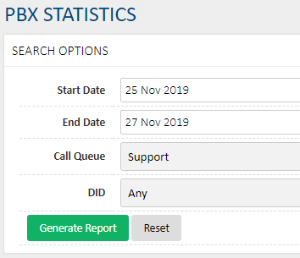
To generate your statistics, you first need to set your filters. Begin by specifying the date range you'd like to see statistics for using the Start Date and End Date fields. If you're targeting a specific call queue, use the Call Queue field to set your target, or if you're targeting a specific DID (phone number), use the DID field to filter only to the specified phone number. To see all queues and DIDs, set these to any.
Once your desired filters are set, click Generate Report.
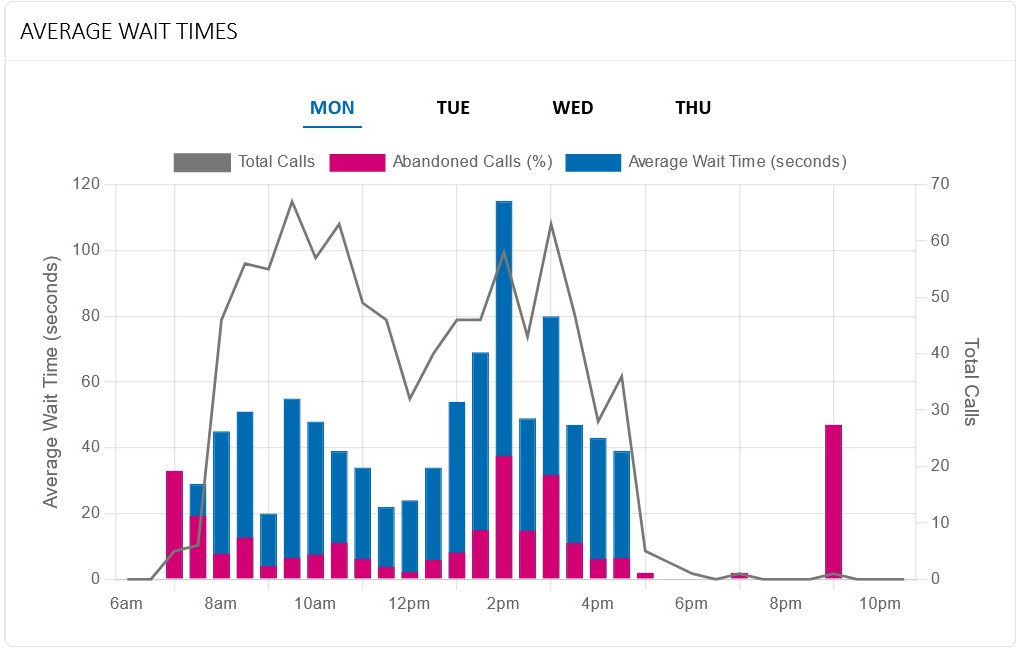
Chart: Average Wait Times vs Call Abandonment at particular Call Volumes
The bars indicate wait times, and the line represents the volume of incoming calls in that 30 minute block.
The taller the bar, the longer the wait. The percentage of the bar coloured red indicates how many callers abandoned their call, and hung up without being answered, or went to voicemail.
It is important to read the call volume line (Incoming Calls) with the wait time data, as in the example below, there was only one caller at 9pm, and they hung up without being answered at the 45 second mark.
Agent Call Distribution
The agent call distribution shows the total number of calls taken per agent within your specified filters.
Each agent is displayed on their own row, displaying the following information:
| Column | Description |
|---|---|
| Total Calls | The total number of calls an agent received within the specific filters, along with what percentage of the total was answered by this agent |
| Agent Hungup | The total number of calls in which this agent hungup before the caller, along with the percentage of the agent's total calls |
| Total Duration | Shows the total amount of time, in minutes, the agent was on calls in the specified window |
| AVG Duration | Shows the average length of the agent's calls, in seconds |
| Min | Displays the agent's shortest call in the specified window |
| Max | Displays the agent's longest call in the specified window |
The additional row for Abandoned shows any calls that weren't picked up by an agent before the caller hung up.
Queue Breakdown
Each of the call queues available in your filter are shown in their own section, with statistics for that specific queue.
The first table lists your call breakdown by DID - this is the number your caller dialled to reach the queue. Each DID is displayed on its own row, with the following information:
| Column | Description |
|---|---|
| Total | Reflects the number of calls that were received on this DID, and the percentage of the total queue calls |
| Answered | Shows the number of calls to the specific DID that were answered (not abandoned) and the percentage of the DID's total calls |
| Voicemail | Shows the number of calls that reached a voicemail, rather than being answered by an agent |
| Abandoned | Displays the number of calls and their percentage of the total where the caller hung up before being answered by an agent or leaving a voicemail |
| AVG Wait | Provides the average wait time before answer of callers dialling in to this queue on the specified DID, in seconds |
| Min | Shows the shortest wait time for a caller before being answered by an agent, in seconds |
| Max | Shows the longest wait time for a caller before being answered by an agent, in seconds |
The second table lists the queue's call breakdown per agent. Each agent is displayed on their own row, with the following information:
| Column | Description |
|---|---|
| Total Calls | The total number of calls an agent received within the specific filters, along with what percentage of the total was answered by this agent |
| Agent Hungup | The total number of calls in which this agent hungup before the caller, along with the percentage of the agent's total calls |
| Total Duration | Shows the total amount of time, in minutes, the agent was on calls in the specified window |
| Average Duration | Shows the average length of the agent's calls, in seconds |
| Min | Displays the agent's shortest call in the specified window |
| Max | Displays the agent's longest call in the specified window |
 Australian Sales team about our phone system plans?


